SenseOCR Table & Chart Recognition: Turn Images into Editable Data
Upload an image to turn tables back into editable tables and read the data out of bar, line and pie charts — no software, right in your browser.
Why tables and charts are so painful to work with
You have probably been here before: a PDF report, a screenshot of a slide, or a table inside a research paper. All you want is the data — but getting it out means retyping it row by row, cell by cell. It is slow, easy to get wrong, and honestly a waste of time.
That is exactly what SenseOCR is for. Upload an image or a PDF, and it turns the tables back into editable tables and reads the data out of charts. No software to install — just open it in your browser.
Table recognition: image in, table out
Drop in a photo or a scan that contains a table, and SenseOCR rebuilds the rows, columns and cells for you — instead of returning a pile of unstructured text.
Before OCR
After OCR
With the result you can:
- Edit it directly — the output is an editable grid, so if a cell is wrong you just click and fix it.
- Export it anywhere — save it as Excel, CSV, TSV, Markdown or HTML, ready for a spreadsheet, a document or the web.
- Copy it in one click — paste straight into Excel or Google Sheets and the rows and columns line up automatically.
- Merge multiple tables — uploaded several images with tables? Combine them into one, with duplicate headers removed.
Typical uses: financial statements, invoices and statements of account, sales figures, survey results, class grade sheets, and data tables in papers. For anything that is readable but tedious to retype, it saves a lot of effort.
Chart recognition: turn bar, line and pie charts back into data
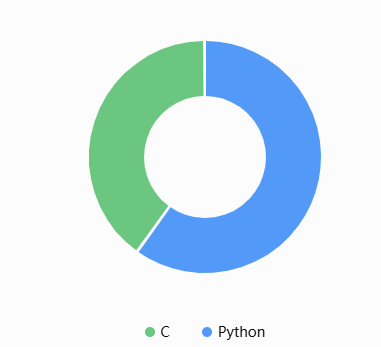
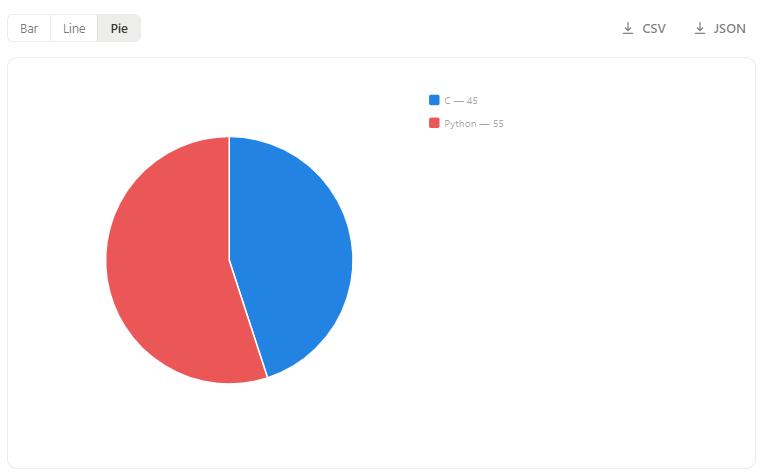
Chart recognition goes one step further. Upload an image of a chart and SenseOCR reads the values behind it, organizing them into a data table — so the bar heights and point positions you used to estimate by eye become exact numbers.
Once you have the data, you can:
- Redraw it to double-check — re-render the numbers as a bar, line or pie chart and compare with the original to make sure nothing was misread.
- Export the data — download it as CSV or JSON and plug it into your own analysis or reporting tools.
Great for: trend charts in industry reports, revenue bars in earnings decks, pie charts from surveys, and curve plots in scientific papers. Far more reliable than reading values off an axis by hand.
Simple, free, ready when you are
SenseOCR’s table and chart tools are standalone, so all you need is a browser:
- Table recognition: senseocr.mylittlecode.com/table-ocr
- Chart recognition: senseocr.mylittlecode.com/chart-ocr
Guests can try it free, and registered users get free credits every day. Beyond tables and charts, SenseOCR also handles full-document text recognition and formulas, with results you can export as Markdown, HTML, plain text, JSON, or a packaged download.
Next time your data is trapped inside an image, give it a try — turning an image into a table, and a table into data, can take just a few seconds.